Blogs
Sign-up to receive the latest articles related to the area of business excellence.
Mean or Median
View All Blogs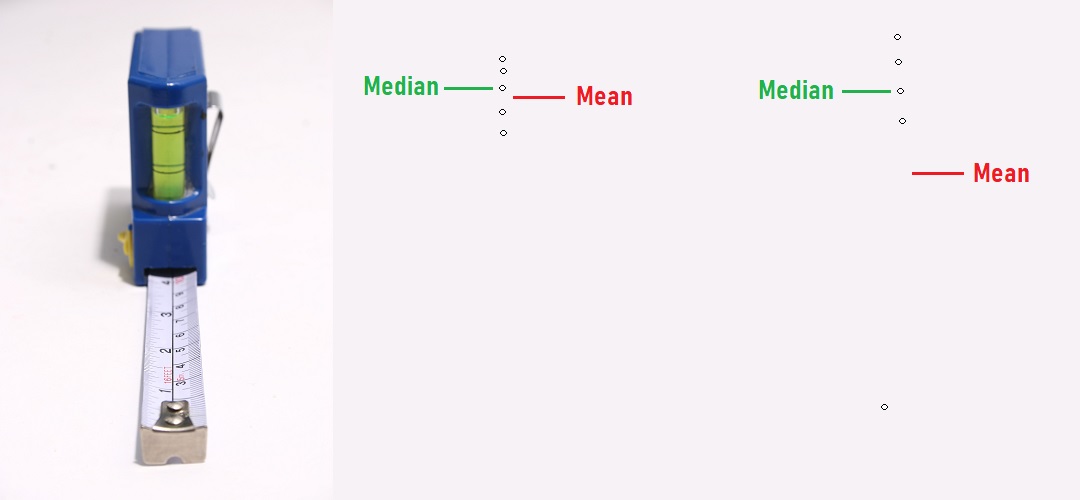
Let’s say that you have collected some data for your process and you want to report the central value or tendency of the data set. What value do you report? There are several ways to measure the central value – the most popular being mean and median. What is the difference between them? How do you calculate these values? Are mean and/or median values sufficient to describe your data set? Which value should you use – mean or the median? In this article, we will look at the mean and median and try to answer the above questions.
Introduction
What do we mean by the central value? Most data you collect typically has variation. You will not get the same value each time you perform the measurement. This variation could be either due to changes in the inputs, the way we run the process, differences in the person who runs the process, the equipment we use to produce the output or due to measurement error. Variation is a fact of life! So, if we collect data and we are getting different values, what is the one value that best describes this data? This value is the called the central location. How can we calculate this value?Theory
One measure is called the mean or the average. The mean value is the sum of all the data points divided by the number of data points. A second measure is called the median. The median value is the value that is located right in the center of your data set if you were to arrange your data set in increasing or decreasing order. A third measure is called the mode, which is the most frequently occurring value in the data set. In most cases, we use the mean or the median to describe the central value.Understanding Mean and Median: If each number was replaced by the mean value, then the overall total of all the values would still remain the same. If there was no variation in the numbers, then the process data value would be the mean value! Mean can take on any value from –infinity to infinity for an arbitrary data set. It is always within the minimum and maximum values of your data set. The median on the other hand is the central number such that an equal number of data points are less than this value and greater than this value. It is also called the 50th percentile or the second quartile. The median does not depend on the actual values of the numbers but only their relative position when you order the numbers in increasing order.
Application
We usually use the mean value to represent the central value of the data set because it has some special statistical properties. However, mean values are significantly influenced by outliers. An outlier is a value that is “significantly” different from the rest of the data values. In the presence of outliers, mean values can change and may no longer be “representative” of the entire data set. Medians on the other hand are more robust to outliers or extreme values. If we have a few outliers, the median value may not change. Thus, we prefer to use the median value in the presence of outliers and mean value otherwise.Both mean and median can be calculated for any data: continuous or discrete. The formula for calculating them does not change either or depend on the actual distribution of the data. For some distributions like the normal distribution, the mean value can help us calculate and understand the underlying nature of the data points and help us predict the probability of occurrence of different values. However, for other distributions for example a uniform distribution, the mean value may not say that much. It would be better for us to understand the minimum and maximum values for a uniform distribution. Similarly, we can also calculate the mean for discrete data set. We need to be cautious how we interpret these numbers. If our data set represents the number of road accidents in a given month. The mean or the median value may not be a whole number (say 4.2 accidents/month). We have to be cautious how we interpret this as we cannot have .2 accidents! Usually, for discrete data, we work with a proportion which is the percentage of road accidents compared to some reference like number of vehicles on the road etc.
Mean and median can be the same value. For example, for the data set is 1, 2, 3. Both the mean and median is equal to 2. Usually, if the data set has a symmetric distribution, both the mean and median values are identical. If the values of mean and median are significantly different, then it points to the presence of a non-symmetric distribution or the presence of outliers.
The mean or the median values by themselves may not be sufficient to describe a process. For example, if we have two data sets: Data set A: 2, 2, 2 and Data Set B: 1, 2, 3. Both of these data sets have the same mean but the data sets are different indicating that the mean or the median by themselves are not sufficient to completely describe the data. You need more parameters to fully describe the data set.
Some examples of the use of mean in the real world are: average temperature of the day, average marks in an exam, average time to get to work. The median values are used when there are possible outliers, like the median home prices in an area, the median salary in a given company etc.
Follow us on LinkedIn to get the latest posts & updates.
